Jupyter notebook绘图
Matplotlib是用于数据可视化的最受欢迎的Python软件包之一,用于从数组中的数据中制作二维绘图,只需要进行必要的导入,准备一些数据,就可以借助plot()函数开始绘图。

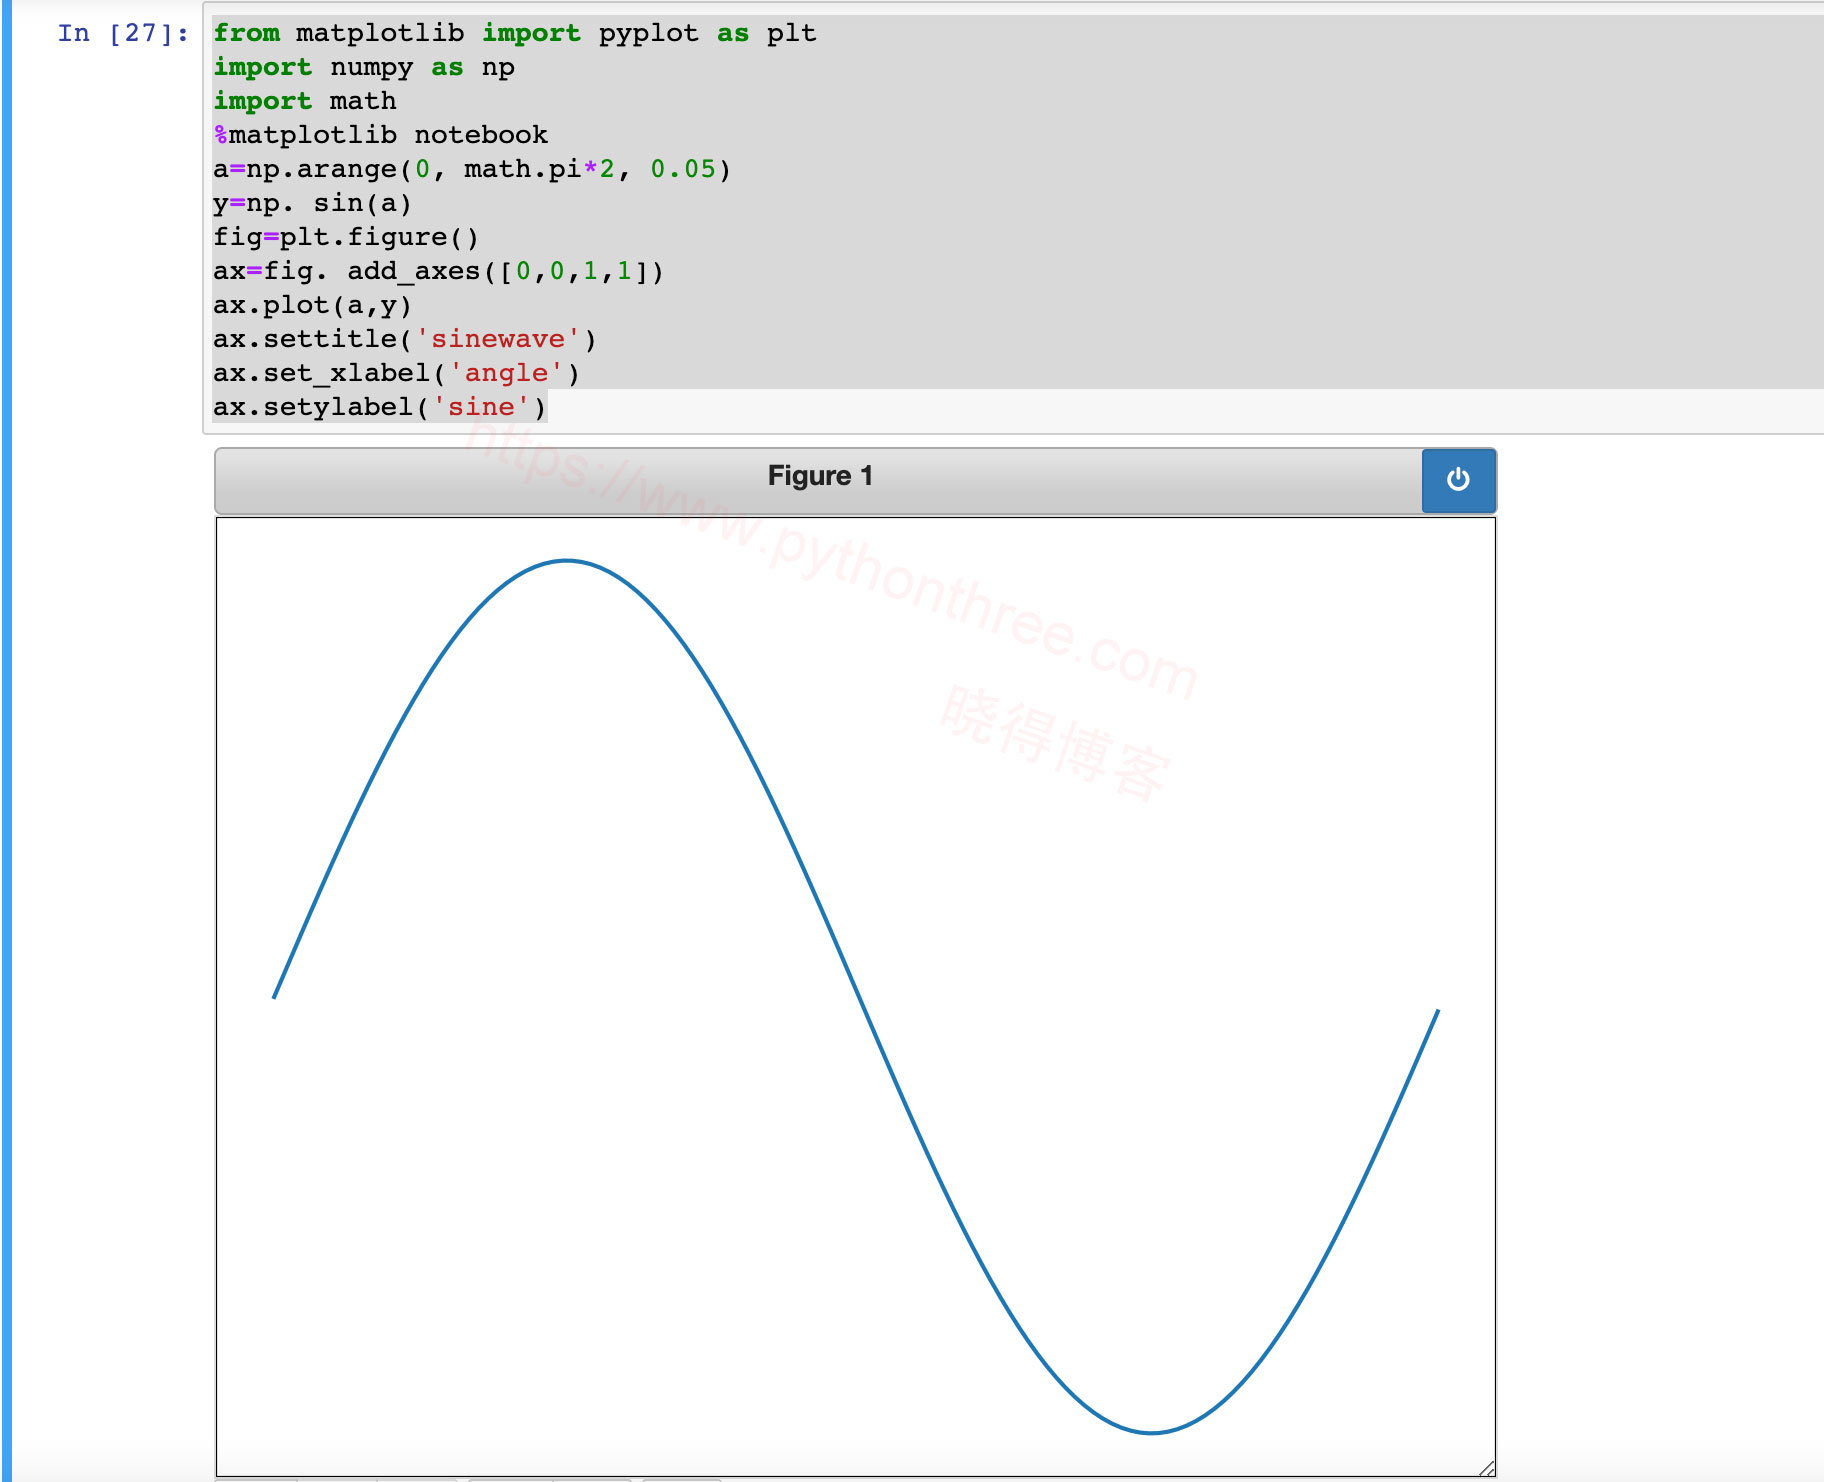
Jupyter notebook的IPython内核能够在输入单元格中显示代码图。它与matplotlib库无缝协作。即使不调用绘图对象的show()函数,带有%matplotlib魔术函数的内联选项也会渲染绘图单元格。
在本章中,让我们晓得博客带您了解Jupyter notebook绘图。
Matplotlib与Jupyter notebook绘图
让我们开始将Matplotlib与Jupyter笔记本一起使用。我们将使用Matplotlib在Jupyter笔记本中绘制各种图表。
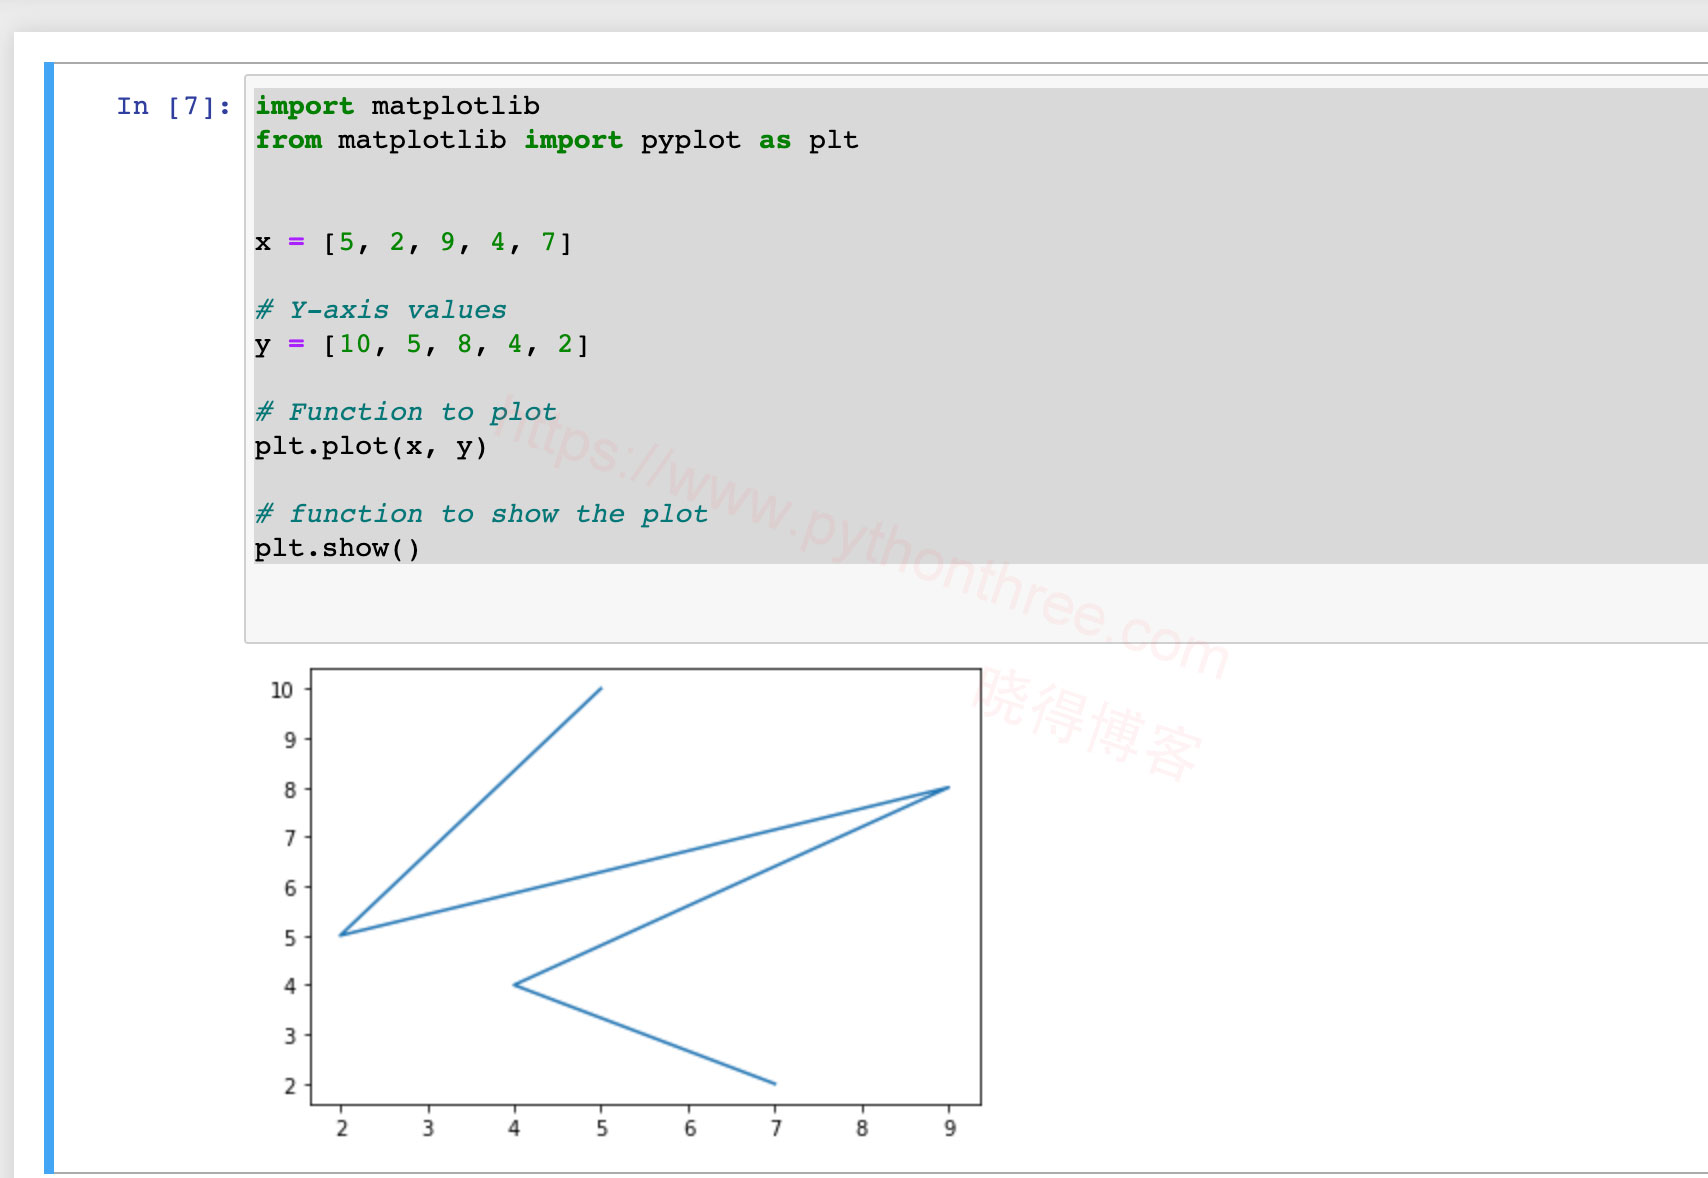
线路图
# importing matplotlib module
from matplotlib import pyplot as plt

# x-axis values
x = [5, 2, 9, 4, 7]

# Y-axis values
y = [10, 5, 8, 4, 2]

# Function to plot
plt.plot(x, y)

# function to show the plot
plt.show()
柱状图
# importing matplotlib module
from matplotlib import pyplot as plt

# x-axis values
x = [5, 2, 9, 4, 7]

# Y-axis values
y = [10, 5, 8, 4, 2]

# Function to plot
plt.bar(x, y)

# function to show the plot
plt.show()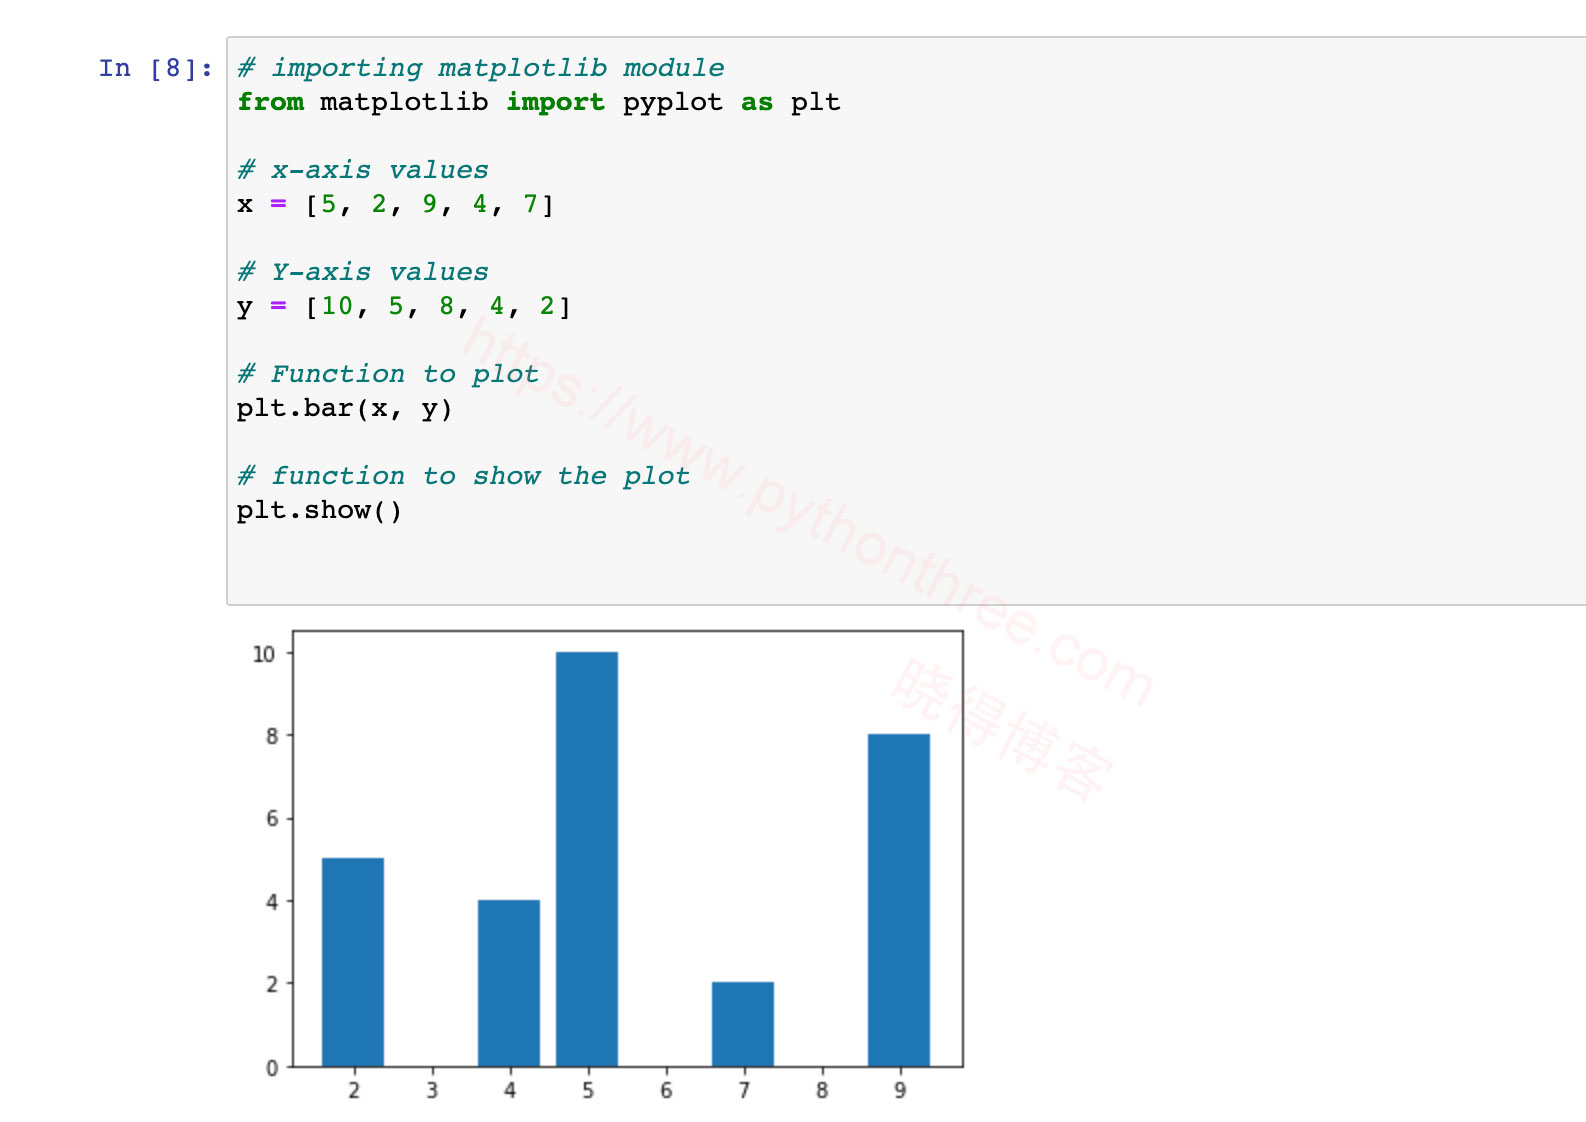
散点图
# importing matplotlib module
from matplotlib import pyplot as plt

# x-axis values
x = [5, 2, 9, 4, 7,9,6,4,0]

# Y-axis values
y = [10, 5, 8, 4, 2,8,3,7,9]

# Function to plot scatter
plt.scatter(x, y)

# function to show the plot
plt.show()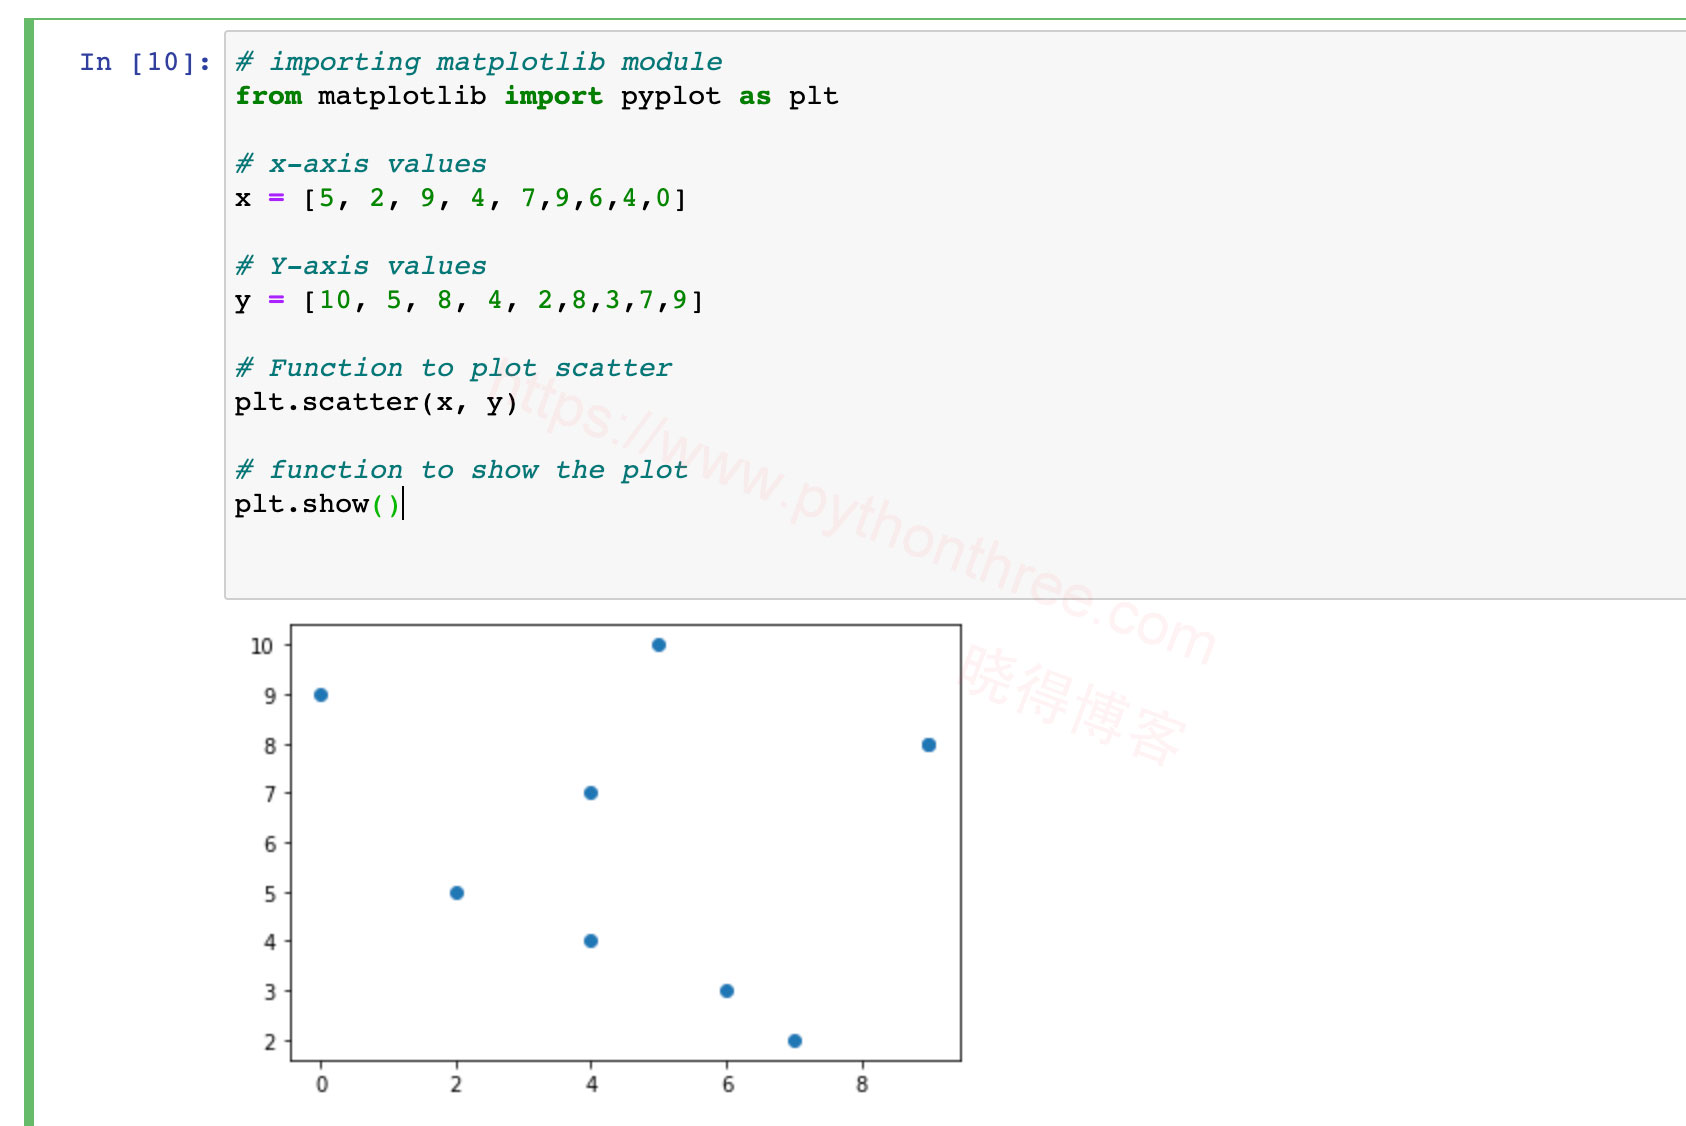
注意:如果提示Module Not Found Error: No module named ‘matplotlib’,则需要安装matplotlib包。
%matplotlib魔术函数渲染
from matplotlib import pyplot as plt
import numpy as np
import math
%matplotlib notebook
a=np.arange(0, math.pi*2, 0.05)
y=np. sin(a)
fig=plt.figure()
ax=fig. add_axes([0,0,1,1])
ax.plot(a,y)
ax.settitle('sinewave')
ax.set_xlabel('angle')
ax.setylabel('sine')